
How the Leaving Cert Grades Are Calculated
As soon as a student hands up their exam script, it is promptly put into an envelope, alongside the scripts of their classmates.
This envelope, along with any documentation of practical components and a preliminary draft of the marking scheme, will eventually be posted out to the relevant examiner for correction, but before any grading actually takes place, the marking scheme needs to be finalized.
For anyone who isn’t already aware, the marking scheme is essentially a detailed rubric to which examiners must strictly adhere when marking exams.
Take a look at this snippet from the 2019 Leaving Cert Higher Level Maths Marking Scheme. The corresponding question asked students to prove, using induction, that f(n) ≥ g(n), where n ≥ 2 and n ∈ ℕ.

Notice in the above example the later adjustments that were made, probably because many students answered the question using a method slightly different from the original marking scheme, but still answered it correctly.
One reason why the marking scheme is mostly just a draft until after the exam is so that it accounts for the student response.
In simple terms, if the exam was universally considered to be extremely challenging, then that will be reflected in a more forgiving marking scheme.
Additionally, the Post-Marking Process, implemented after Covid-19, will also affect the outcome of the Leaving Cert results – but more on that later.
But why was the exam so difficult in the first place?
Well, there’s no one answer to this question. But here are our best guesses:
- The people writing the exam papers are maths teachers, not clairvoyants. Technically, everything that was on that exam paper was acceptable for Higher Level Leaving Cert Maths, because everything asked could be linked back to the syllabus. However, that doesn’t mean that this particular combination of questions was the most accessible for the average student – but that’s only something that becomes clear in its aftermath
- In 2022, the Maths Paper 1 that was administered was very fair. Additionally, students were not only given extra time but also a choice as to which questions to answer. While this measure was introduced to make up for the teaching hours lost over the pandemic, it did inadvertently give LC 2022 students a clear advantage, and so they were subjected to a pretty cruel marking scheme to compensate. So, it’s entirely possible that the SEC’s approach this year was to do a complete 180° to put an end to the points inflation.
Whether or not the SEC had a calculated plan, it backfired in no small way. So, we foresee a very nice marking scheme to counteract this very nasty Paper 1.
But don’t think for a second that the SEC acts with purely the student’s best interest at heart.
Standardising Leaving Cert Grades
Another reason why the SEC postpones finalizing the marking scheme until after the exams is to ensure that they maintain consistency in standards from year to year.
That’s right, the SEC wants a pretty similar number of passes, fails, and top marks every year. There’s a couple of different reasons for this that we won’t get into in this particular article, but on a purely surface level, one of these reasons is to maintain the grading curve or ‘bell’ curve.
And for anyone trying to argue on the side of the curve not existing, behold this original meme of Millie Bobby Brown trying to defend her former view that the earth is flat – this is what you sound like:

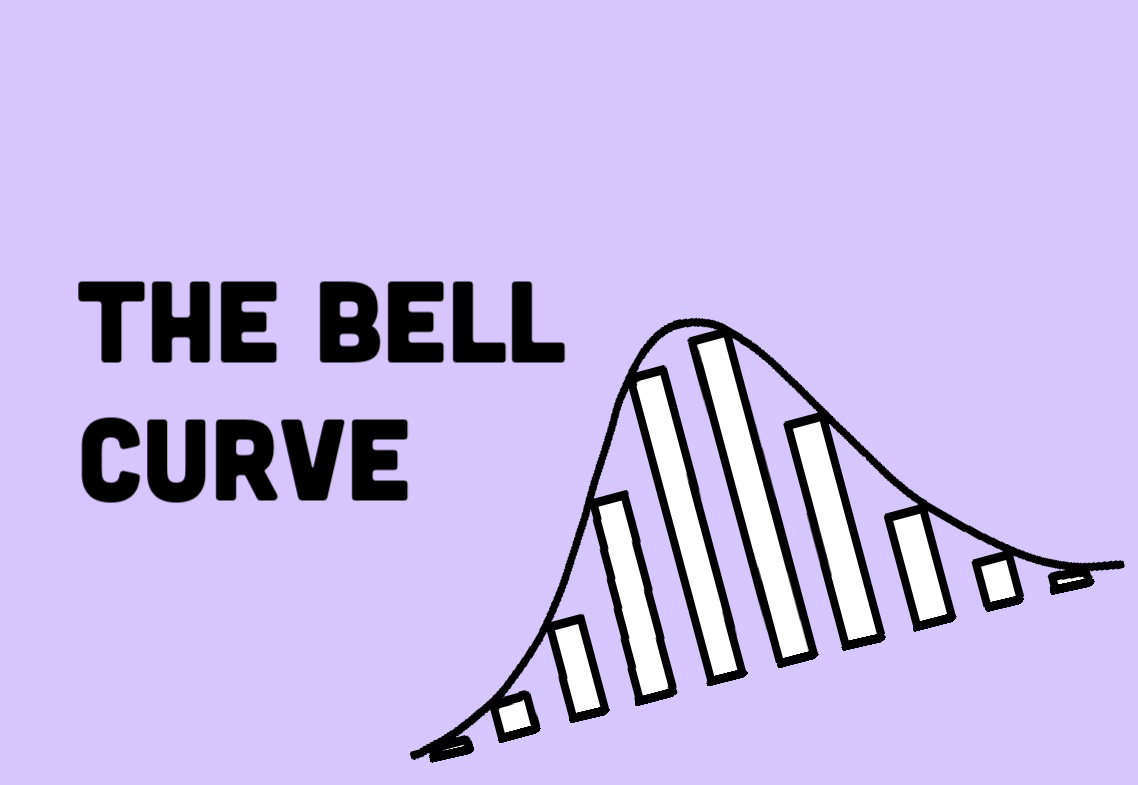
Leaving Cert Bell Curve
The bell curve is the term used to describe the statistical distribution of grades achieved by students in the Leaving Certificate, so named because it takes on the shape of a bell almost every single year.
You should remember at the very least what a bell curve is from your statistics lessons in Maths. Basically, they look like this:
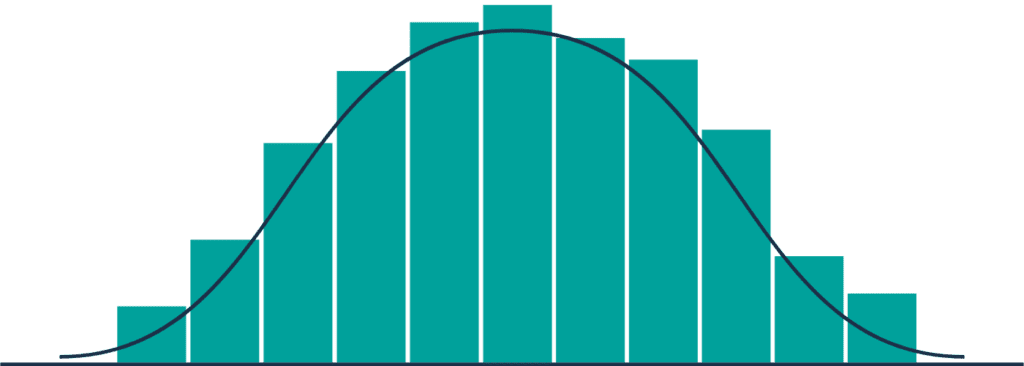
If you paid extra close attention in Maths class, you may also recall normal distributions and the Empirical Rule.
But if you used every last drop of Statistics knowledge on this week’s Paper 2, then here’s a quick reminder:
In a normal distribution table, 68% of the data lies within one standard deviation of the mean, 95% lies within 2 standard deviations of the mean, and 99.7% lies within 3 standard deviations of the mean.
The data from the Leaving Cert Maths results form a normal distribution every single year, which means that the Empirical Rule applies.
Let’s have a look at the data from 2019 as an example:
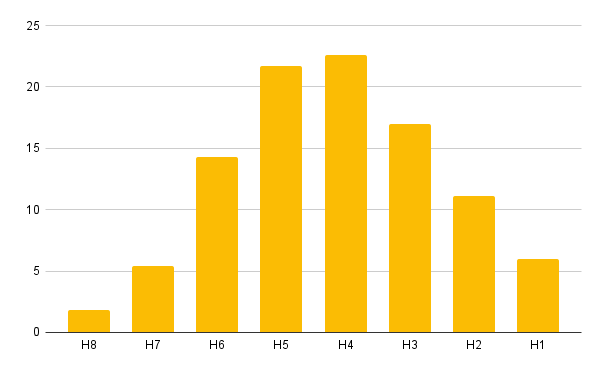
Notice how the majority of the data is clustered around the H4/H5 mark? For years, this was the average or mean grade in Higher Level Maths.
Notice also how few people are failing or receiving a grade below a H7. This also speaks to how the data can be represented on a normal distribution – 95% of people achieve within two standard deviations (15 or 16%) of the average H4/H5 grade!
Now that we understand that the bell curve does indeed exist and that it represents the data from the Leaving Cert results, let’s take a look at the last couple of years’ Leaving Certs on the graph for comparison:
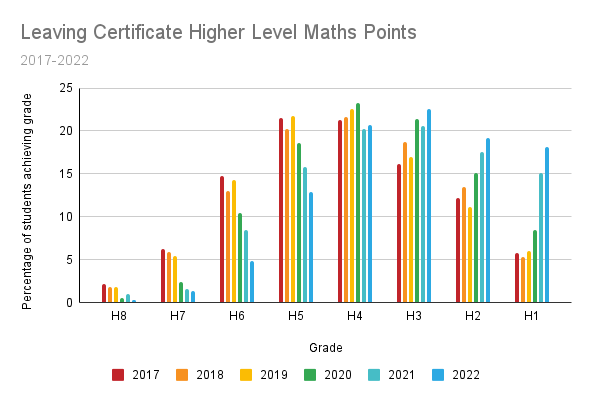
Up as far as 2020, the numbers were highly similar from year to year. We’ll discuss the change in this trend in a moment, but can you see now how the SEC strives to maintain consistency in the grading and bell curve?
Now, let’s take a look at the shift that has occurred and how that will affect this year’s bell curve.
COVID’s Affect on the Bell Curve
The keen eye will spot a slight negative skew in the data after the 2020 Leaving Cert, and this is no coincidence.
The 2020 Leaving Cert saw the first Lockdown Leaving Cert, where students were offered predicted grades in place of sitting the traditional Leaving Cert. These grades were slightly inflated compared to the previous year, but this trend only continued in the years since, resulting in a slightly warped bell curve. Take a look below:

In 2022, 18.1% of students who sat Higher Level Maths got a H1, which is more than triple the amount who achieved the top grade back in 2018. This is mostly down to the adjustments that we talked about earlier.
That said, you can best believe that the SEC wants these numbers to eventually drop back down to pre-pandemic levels, hence the very difficult paper this year.
The process of reverting to the original bell curve will be gradual to avoid the so-called “cliff-edge” (check out the Department of Education’s statement on the Post-Marking Process here) so we don’t expect vastly different figures this year, but there will most likely be fewer high grades than last year.
2024 Bell Curve Prediction
There’s no way for us to know exactly how this year’s results will pan out.
However, we can use historical trends to make some predictions:
- The failure rates over the last 5 years have remained below 3% and even dropped below 1% in 2020 and 2022. The odds of failing Higher Level Maths outright are extremely low. We predict less than 2% will fail this year.
- Similarly, the number of people who pass the Higher Level Maths exam but do not get the 25 extra points, which is awarded to students achieving a H6 or higher, is also very low. At its highest, it was just over 6%, and that number has only gotten smaller in recent years. Again, we predict that 90% of students who sit the exam will get the extra 25 points.
- The average grade has gotten higher since the pandemic years, and it is unlikely to drop back down overnight. We predict that the average grade in Higher Level Maths will be a H4.
- Conversely, we expect the number of people who achieve H1s will decrease. This year’s Paper 1 will be marked easier, but no student receives a H1 grade without deserving it. We predict the number of students achieving H1 grades will fall by a few percent.
Conclusion
This year’s Paper 1 was tough, but it really isn’t the end of the world. There’s still a strong possibility the paper will be marked easier in light of the students’ response. As well, Paper 1 is worth just half of your grade, and Paper 2 was a very fair paper by our estimations.
The SEC has to constantly spice things up, otherwise we’d all get 625 points, but they’ll always come back to the bell curve. That goes for every subject, not just maths! Check out RTÉ Education Correspondant Emma O’Kelly’s article on the matter if you want to learn more.
TJ— CEO of Breakthrough Maths.
Need help in Maths? Contact the Breakthrough Maths team here.